6 minute read • published in partnership with Evocon
Insight: Unlocking the value of live OEE data
Your team has successfully navigated the terrain of understanding what OEE is and is getting live OEE data from your machines on the production floor. Now you can view performance as it happens and understand historical trends with more detail and accuracy than ever before. It is the goal that you have all been looking forward to reaching, and it is beginning to materialise. Everyone is curious, operators on the shop floor, maintenance technicians, the plant leadership team, and even an executive or two – Evocon explores the value of live OEE data.
You have had a nagging thought for a few days now. It comes to mind each morning as your team runs through the production reports on OEE. Now that we have live data, just what can we do with it? Better still, are there any best practices out there that we should know about?
If you have found yourself asking some version of this question, you are not alone. In our years of experience working with companies through Digital Transformation, and especially with OEE, it is the most common question we have heard. “Great, we implemented OEE software, have live OEE data, now what?”

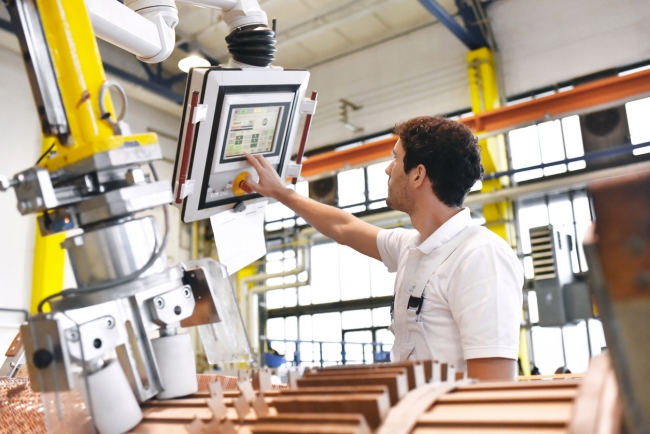
Once a manufacturer is getting live OEE data from its machines on the production floor, the goal is to unlock the value of this data / Picture: Getty/iStock
1 – Visualise your production data and OEE
As humans, visualisation drastically improves our ability to work with and understand complex data. Not only are we able to comprehend the information faster, but relationships are easier to identify.
In the days before data automation companies would typically collect raw data into a database. Then an analyst would periodically refresh and distribute a report containing some charts and graphs. The main drawback to this approach was that managing, maintaining, reporting, and distributing data sets, charts and graphs required a knowledge workers time and attention. Further, once managers received the data, it was mostly static and not interactive.
A best practice that came about through digital transformation was the automation of data collection, storage, and retrieval. It enabled companies to have knowledge workers perform value-added tasks. Moreover, it made interactive data not only possible but standard practice.
2 – Begin working on displaying live OEE data on the shop floor
The key to this benefit is rather straightforward. In the near past, machine operators manually filled out forms with data to calculate OEE. Collection and collation of this data allowed us to produce and distribute reports. It was helpful for analysis and monitoring trends over time but did not provide an opportunity to correct problems as they occurred. In short, this restricts a company from acting in the moment to fix a problem, which is one of the common mistakes in OEE calculation.
Best practice today is to display OEE performance as it happens, giving operators and others in your production process a chance to react to problems as they occur. Clearly, this is much better than only to know that a problem occurred in the past.
Moreover, with real-time views of performance, machine operators tend to be more invested in keeping the data in the system accurate. It is also common for healthy competition to either improve on past performance or another shift’s performance.
There are several options to consider when thinking through the decision of what to show on the shop floor. We recommend displaying a real-time overview of shift performance rather than just OEE itself. This is because your OEE percentage alone can be somewhat abstract. By comparison, it is easy to understand the number of good/bad units for a shift and the relationship of downtime to planned production. Moreover, this information is easier to react to in the moment.
3 – Set a baseline against to measure performance
Once you begin to realise the benefits of visualising your data, the next step to unlocking the improvement potential that comes from measuring OEE is to set a baseline to measure performance improvement against.
It is crucial to avoid the tendency to compare your OEE performance against a world-class benchmark. Similarly, comparing historical trends for OEE based on manually collected data is not helpful. The latter is not meaningful as the number of variables that once existed in the process of reporting data are now removed. While it isn’t impossible that the result of automating the process will not change the outcome of the OEE calculation, it is undoubtedly the exception if it remains the same.
Measuring against a world-class benchmark is also unwise and counterproductive. The idea to remember here is that the point of OEE is not the number that you score. Instead, OEE is a great way to understand the potential for improvement that exists. Thus, more important is the rate at which you improve the number, rather than what the numerical value is when you get started. It doesn’t matter if your first OEE numbers are 20% or 75%. What matters more is the creation of a baseline and for you to begin improving on it.
Monitoring production and having access to live OEE data allows a manufacturer to optimise process improvement / Picture: Getty/iStock
4. Combine with Theory of Constraints (TOC) – improve the throughput of a bottleneck resource
You will naturally use live OEE data across the plant and on a variety of different machines. We further recommend combining your efforts to improve OEE with TOC. TOC has conclusively demonstrated that raising the throughput of a bottleneck resource benefits the entire production line.
The application of TOC will be to focus on the constraint, or bottleneck, in your production line. To do this, simply identify which machine has the lowest throughput and begin studying the OEE data that is specific to it. It would be best if you aimed to identify where losses come from and work to improve in these areas.
5. Focus and optimise process improvement
When an individual is far or nearsighted and gets their first pair of glasses, the first thing they usually say is that they can see leaves on trees. Much like the person before glasses, a plant without access to live OEE data can struggle to determine where to focus their process improvement efforts, or to continue the metaphor, to see that the tree has leaves.
Monitoring production and having access to live OEE data gives your production plant the keys to understanding where losses are coming from. Once you know where on the production line your biggest losses are occurring and what type of losses they are, you have the ability to focus on the areas where your process improvement teams will have the biggest impact and in essence, optimise the use of this scarce resource.
In our years of experience with live OEE data, this is among the most powerful ways to utilise the information.
6 – Identify the most significant contributing factor to production losses – and put it under a microscope
Using a “5 Why Analysis” as the following example demonstrates can be quite helpful in machine downtime analysis.
The point of the 5 why analysis is to get to the root cause of the problem and to explore potential solutions. Often the root cause is apparent without asking why all five times. This was the case with our hypothetical example above. In this case, live OEE data can be used to justify the expense of developing the tooling to allow for continuous cleaning of nozzles. This is a subjective call, but one that common sense usually will sort out as you work through each why.
Regardless of whether you utilise the 5 why’s or another common process improvement technique, the vital thing to remember is to drill into the problem in detail. It will usually require some disregard for the status quo and a willingness to reject the notion that nothing can be done to improve. In practice, we have rarely come across a process which couldn’t be improved in some form or fashion. So, once you identify your top loss, put it under a microscope, then improve it.
7 – Begin using live OEE data to incentivise improvements
As the popular book Freakonomics correctly points out, incentives are powerful tools for shaping behaviour and outcomes. As such, it only seems natural to begin planning how to apply incentives to improvement gains now that you have live OEE data.
Plans to incentivise OEE improvements can come in many forms and you should tailor them to your unique situation. This is to say that there is again no one size fits all approach. That said, there are a few points to keep in mind as you begin this step.
First, a few basic requirements to get going will be that you define your performance baseline and that all operators are trained and competent in utilising the software to report correctly on OEE.
Second, we recommend that you also have in place the capability to display OEE on the shop floor in real-time. While not a requirement for this step, we are firm believers that in order to get the most from your efforts to incentivise OEE performance, showing operators how they are being measured and what the measurement is, is the optimal solution.
These are, however, only a few basic steps for what is an expansive topic.